Connect a PocketLab Sensor
There are two places to collect data: on the Trials page or in a Notebook Lesson.
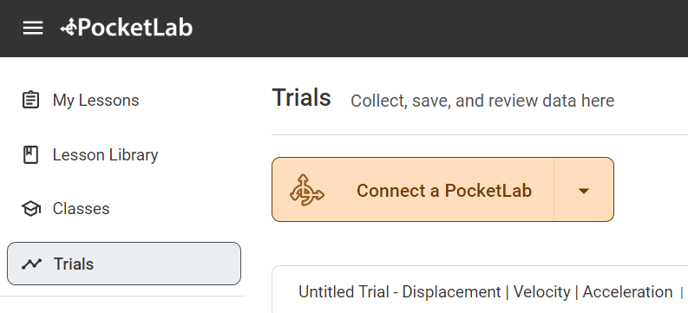
- Click "Connect a PocketLab".
- A Bluetooth connection window will appear.
- Turn your PocketLab sensor on by pressing the button on top of the sensor. Lights should begin flashing on the sensor.
- Select your PocketLab in the Bluetooth connection window and then click "Pair". If there are multiple sensors in the window, select the one with the highest signal strength since that one will be closest to your computer.
- Your PocketLab will connect to Notebook.
Collect and Analyze Data
When a sensor is connected, there are several options to change how to data is displayed.
Recording and Saving Data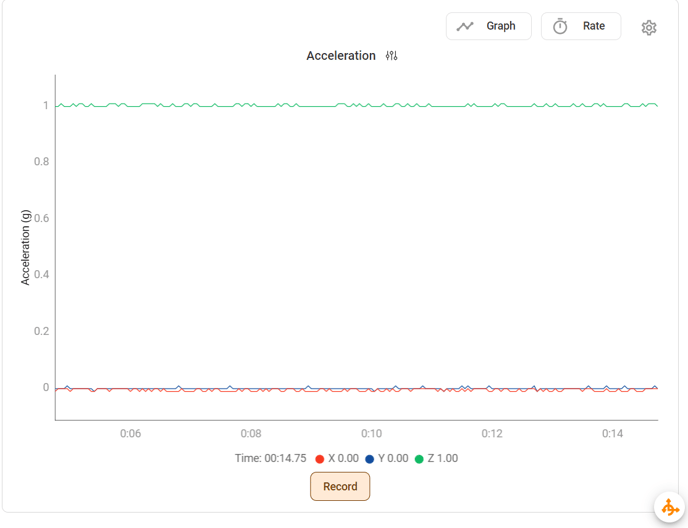
- Click "Record" to start a data recording.
- Click "Stop" and "Save" to save your recording.
- Click the dropdown to save as a .csv that can be opened as a spreadsheet.
Switching Graphs
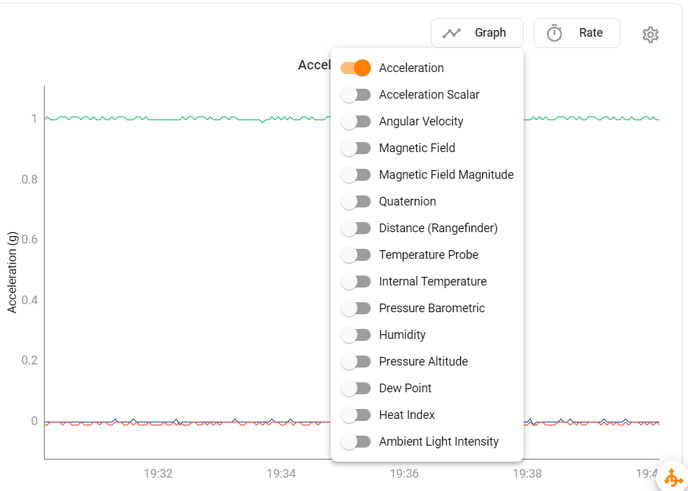
- Click "Graph" to open the graph select menu.
- Select which graphs you want to view.
- To close the menu, click "Graph" again or click outside the menu.
Changing Data Rate
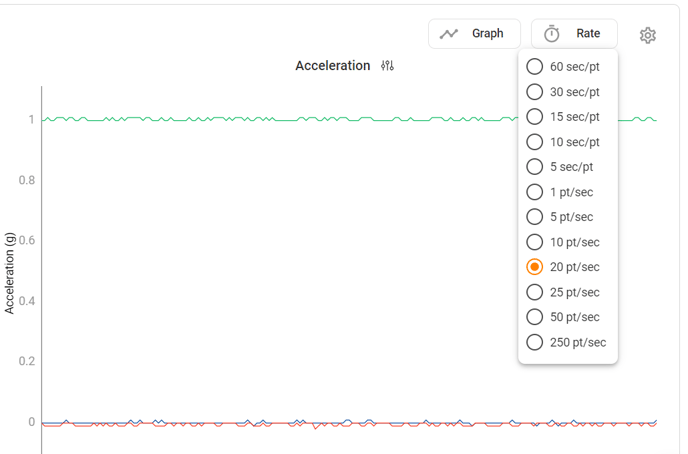
- Click Rate to change how quickly the data points are collected.
- Faster data rates are better for recording things that happen very quickly, like a collision.
- Slower data rates are better for recording over long periods of time.
- The default data rate is good for most standard use cases.
Changing Graph Display Settings
There are several options to change how the graphs are displayed in the Graph Display Settings menu.

- Click the settings menu icon next to the Graph title (Acceleration in the image above).
- Change the Axes that are displayed by clicking XYZ.
- Change the graph between a line graph, bar graph, minimized view, or speedometer style display.
- Change units by selecting g or m/s^2.
- For some graphs, there is an option to zero out the sensor in this settings menu.