Importing Data saved from PocketLab Notebook or the PocketLab app
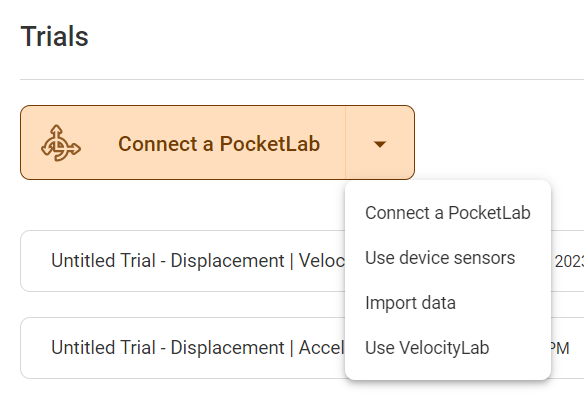
- Click the dropdown next to Connect a PocketLab.
- Click Import Data and select the .csv file you'd like to upload.
- Choose "elapsed seconds" for the x-axis.
Note: This is part can be confusing because the other "time" option is the date and time that it was recorded (hours: minutes: seconds). Choosing "time" instead of "elapsed seconds" will not show anything on the graph because it is the wrong format. - Choose one or more data sets to graph on the y-axis.
- Label your axes. These are the labels on the side and bottom of the graph. We recommend labeling them with the name and units, for example, "Time (s)" on the x-axis" and "Temperature (C)" on the y-axis.
- Label the data set(s). These are the labels for the lines graphed from the y-axis values. We recommend labeling them with the name of the y-axis measurement, for example, "Temperature".
Importing Data from other Sensors
- Make sure your .csv data is formatted correctly. The first line should be headers for each measurement separated by commas and each subsequent line should include an equal number of data values as the number of headers. Your data should include elapsed seconds starting from the beginning of the recording. For example:
Elapsed Seconds, Temperature
0.0, 25.0
0.1, 25.1 - Click import data and select the .csv file you'd like to upload.
- Choose the title of the column in your data that has elapsed seconds measured from the beginning of the recording.
- Choose one or more data sets to graph on the y-axis.
- Label your axes. These are the labels on the side and bottom of the graph. We recommend labeling them with the name and units, for example, "Time (s)" on the x-axis" and "Temperature (C)" on the y-axis.
- Label the data set(s). These are the labels for the lines graphed from the y-axis values. We recommend labeling them with the name of the y-axis measurement, for example, "Temperature".