Setting Your Location Permissions in PocketLab Notebook
In PocketLab Notebook, when you first go to thepocketlab.com/app in Google Chrome, a prompt asks for your location permissions. If you click Allow you’ll be able to access location features. If you click Deny you won’t get the mapping features. The prompt appears the first time you access the site, but you can change your settings at any time by clicking the map waypoint icon in your address bar. If you update your settings you'll have to reload the page for the changes to take effect.
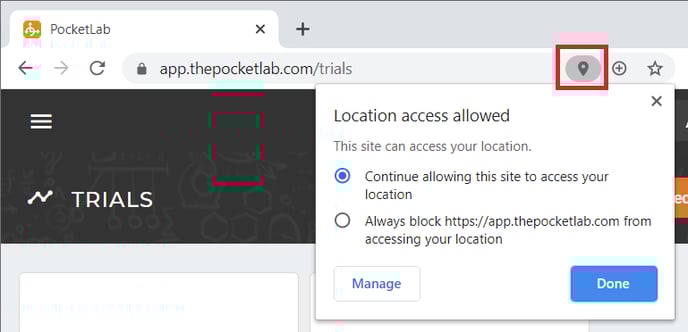
If the map shows a location in the middle of the ocean, the app is not currently able to pull your device’s geo-location. Make sure you are using Google Chrome and have your location access allowed as shown above.
Mapping Recorded Data
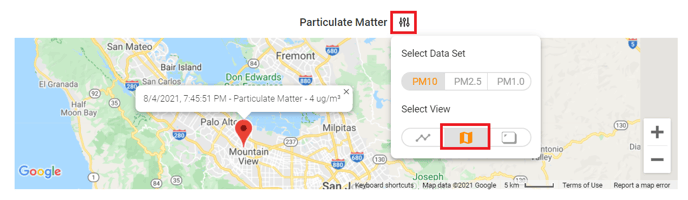
Currently, the mapping feature pulls in publicly available air quality data from the nearest EPA station and puts it on a map so you can compare your readings.
In PocketLab Notebook, you can toggle the visualizations of the sensor data from “Graphs” to “Map” using the “Graph Options” button (three lines) for each graph. When visualizing the data on a map, the graph will plot “pins” of the data at your current location. This may become hard to read. We are developing easier-to-use and read data mapping visualizations.
Latitude and longitude data will be available in the .csv file of the recorded data if you’ve given the app permission to access the data.
The PocketLab Air itself does not have a GPS unit. It uses the location data from your connected device for the mapping features.
Note: Mapping features are currently unavailable in the iOS app, but saved CSV files of your data will include latitude and longitude coordinates if you have location access enabled. You can always go back and change those permissions in your device’s settings menu. Mapping features will be coming in an iOS update soon.
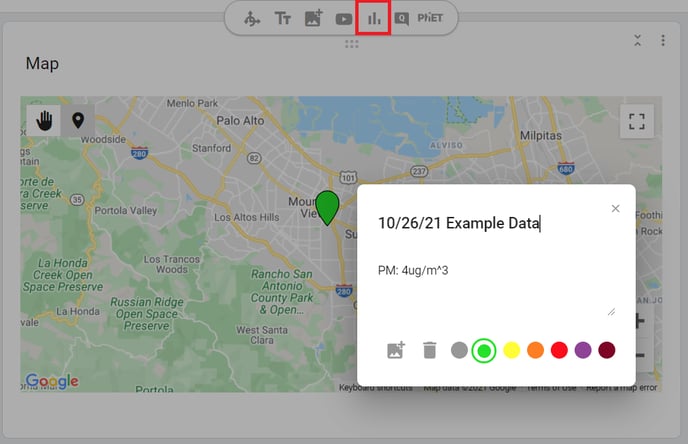
Mapping Data Manually in Notebook
You can also use the Data Analysis Map Section in a Notebook Lesson to map data points manually. You can add images, notes, and color code waypoints on the map. This is a great way to map data from multiple trials and visualize differences across a geographical area.